Bitcoin is a major paradigm shift that is drawing people into the world who have never before been interested in how the current monetary and financial system works.
Many people who buy Bitcoin have never even been interested in the world of traditional finance.
These people understand that their interest in succeeding in the Bitcoin world is to take advantage of their greatest natural advantage: the confidence they will develop in the Bitcoin revolution, and ultimately, the time they will be able to HODL Bitcoin no matter what.
Nevertheless, these people are constantly seeing different acronyms pass by that they don’t understand. With Bitcoin teaching us the importance of developing our critical thinking skills, it is essential to understand what these acronyms mean.
What is the Relative Strength Index (RSI) of an asset?
In this article, I’d like to revisit with you a frequently used indicator called the Relative Strength Index (RSI).
The first thing to remember is that the RSI is not a Bitcoin-specific indicator. It has been used in the stock market for a very long time. This indicator is calculated from the price momentum of an asset.
Several factors are taken into account when calculating the RSI of an asset like Bitcoin. These factors are the price change of the asset in question and the speed at which this change occurs. These movements, which can swing sharply from one extreme to another, are considered oscillations.
Bitcoin’s RSI oscillations are therefore rated between 0 and 100.
Bitcoin’s RSI reveals whether it is overbought or oversold
From Bitcoin’s RSI, you can tell at any given moment whether Bitcoin is overbought or oversold. At an RSI of 70 or higher, the asset in question is considered to be overbought. An asset is considered oversold when the RSI is below 30.
Investing is not an exact science, but this is simply a signal for traders to identify the price trend of an asset, the divergences, and the potential swings.
To give you an idea, here is the evolution of the RSI of Bitcoin since mid-2017:
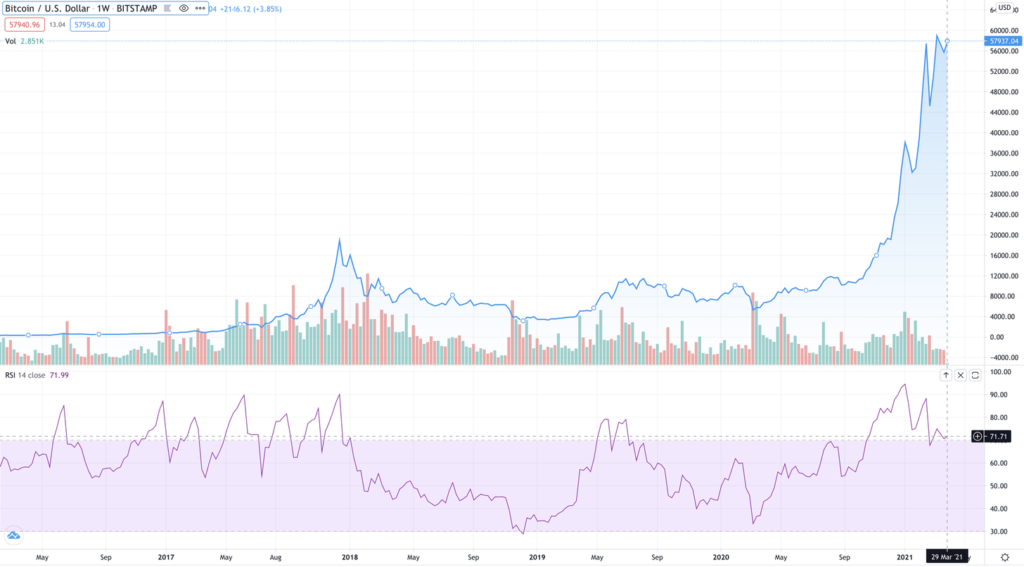
On this chart, you can see the blue line that represents the evolution of the price of Bitcoin. It is very close to $58K at the time of writing.
At the bottom, you can see in purple the evolution of the RSI of Bitcoin.
Currently, the RSI of Bitcoin is 71.7. We are slightly above 70. So some people are talking about Bitcoin being at the beginning of an overbought trend. Nevertheless, you should keep in mind that the 70 and 30 values are not fixed.
Some people prefer to consider 80 and 20 as thresholds.
The RSI is used in technical analysis to determine bullish or bearish divergences
Under these conditions, Bitcoin would not yet be in an overbought market. It was at the beginning of 2021 when it exceeded 90. The current period that has seen the price of Bitcoin stabilize between $53K and $58K was, therefore, necessary to allow the market to take a break before going on to break new records.
Traders use Bitcoin’s RSI for their technical analysis. From the RSI, they determine whether the market is in a bearish or bullish divergence.
In the case of a bullish divergence, the RSI rises as the price of the asset in question continues to fall. This shows that more and more people are continuing to buy the asset in question while its price is falling. Confidence continues to be present in the asset.
For a bearish divergence, the RSI falls while the price of the asset rises. This highlights the fact that the asset is losing its upward momentum.
The RSI is measured based on the change in an asset’s price between 14 periods, which can be either daily or hourly based. The average gain of the asset within the period and the average loss are divided and plotted on the zero to 100 scale.
It is interesting to study the RSI on multiple timeframes: 1 day, 6 hours, and 1 hour. This gives a better indication of how the price moves over a short, medium, or long-term period.
Final Thoughts
As I explained in the introduction, the RSI is mostly used by Bitcoin Traders. Nevertheless, even if you are a Bitcoin HODLer, you owe it to yourself to know what it means, but especially how traders use it.
This will allow you to better understand the short-term price movements of Bitcoin and the technical analysis using RSI that can appear on various sites.
After reading this article, the RSI will hold no secrets for you. You will also have understood why I think this Bull Market is still in its infancy. During the Bull Markets of 2013 and 2017, Bitcoin’s monthly RSI was above 95 for at least 3 months.
As you can see we are still a long way from that in 2021. This Bull Market still has huge opportunities to offer all those who believe in Bitcoin.
Wanting more insights on Bitcoin? Join In Bitcoin We Trust Newsletter.